(Photo by Tim Boyle/Getty Images)
Especially after the holiday's it's great to save money where you can and another sales tax holiday kicks off New Year's Day in Florida.
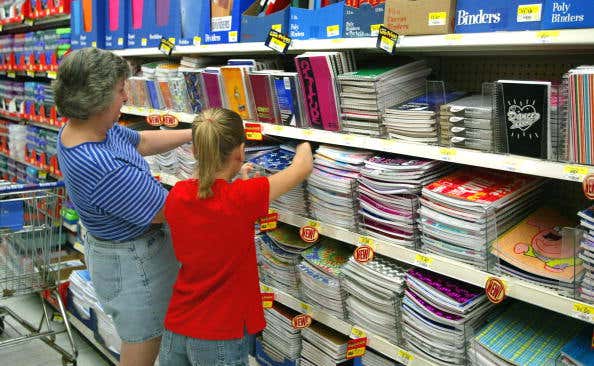
I used to love going back-to-school shopping. I'd have my list in hand and my mom would let us go wild, picking out anything we wanted. Hey, if it was a way to get us excited about school, I don't blame her. I had my Lisa Frank folders, my Hello Kitty pencils and I was ready to go. But I imagine with 3 of us kids, shopping got expensive.
Another Sales Tax Holiday Kicks Off New Year's Day In Florida
With the prices of everything going up these days, it's great to be able to shave off a few dollars and cents where you can. And when you think back-t0-school, you probably think fall. But after the holiday's, kids are going back to school once again. And if you need to restock on supplies that you may have used up in the first semester, this will be a great time to do that. The Back-To-School Sales Tax Holiday in Florida kicks off January 1st and goes for 2 weeks through January 14th.
According to NBC6, no sales tax will be collected in Florida those 2 weeks on all things back-to-school. Think any sort of school supplies under $50 per item like crayons, notebooks, glue, markers, scissors. Also learning aids like flashcards, puzzle books, nesting blocks. Computers and tablets are included if the sales price is $1500 or less. And another huge part of the tax holiday, is the tax break on clothing and shoes, under $100 per item.
You can check out the full list of tax exempt items and what is included in this 2024 sales tax holiday here
New Report Shows Florida Has the 9th Best School System in America
The Florida school system have been in the news a lot lately. Even though much that is said is negative, it turns out, our schools actually grade fairly well. When you look past the headlines and dig into the data, it seems things aren't bad at all. In fact, this new report from Wallethub shows that Florida has the 9th best school system in America.
In order to determine the best school systems in America, WalletHub compared the 50 states and the District of Columbia across 32 key measures of quality and safety. The data set ranges from pupil-teacher ratio and dropout rate to median standardized-test scores. We'll break down fully where the numbers come from in a bit, but here's the snapshot.
Quality & Safety of Schools in Florida (1=Best; 25=Avg.):
All very respectable numbers. Also, as you plan for Back To School, keep in mind that this is the Tax Free Week for school supplies in Florida. Prices have gone up on everything, so save where you can.
Now, unlike other research that focuses primarily on academic outcomes or school finance, WalletHub’s analysis takes a more comprehensive approach. It accounts for performance, funding, safety, class size and instructor credentials. To determine the top-performing school systems in America, WalletHub compared the 50 states and the District of Columbia across 32 key metrics.
Main Findings
Public School Ranking by State
Note: With the exception of “Total Score,” all of the columns in the table above depict the relative rank of that state, where a rank of 1 represents the best conditions for that metric category. To see all 51, see the full report here.
Dropout Rate
- 1. West Virginia
- 2. Iowa
- 3. Kentucky
- 4. New Jersey
- 5. Indiana

- 47. Oklahoma
- T-48. Alaska
- T-48. Arizona
- T-48. New Mexico
- T-48. District of Columbia
Math Test Scores
- 1. Massachusetts
- 2. Wyoming
- 3. Utah
- 4. Nebraska
- 5. Wisconsin
- 47. Oklahoma
- 48. Delaware
- 49. West Virginia
- 50. District of Columbia
- 51. New Mexico
Reading Test Scores
- 1. Massachusetts
- 2. New Jersey
- 3. Utah
- T-4. Colorado
- T-4. New Hampshire
- 47. Oklahoma
- 48. Alaska
- 49. District of Columbia
- 50. West Virginia
- 51. New Mexico
Median SAT Score
- 1. Wisconsin
- T-2. Kansas
- T-2. Utah
- T-2. Wyoming
- T-5. Minnesota
- T-5. Nebraska
- T-46. Delaware
- T-46. New Mexico
- T-46. Rhode Island
- 49. Oklahoma
- T-50. District of Columbia
- T-50. West Virginia
Median ACT Score
- 1. District of Columbia
- T-2. California
- T-2. Connecticut
- T-2. Massachusetts
- 5. New Hampshire

- T-44. Alabama
- T-44. Arizona
- T-44. Louisiana
- T-44. Mississippi
- T-44. North Carolina
- T-44. Oklahoma
- T-44. Tennessee
- 51. Nevada
Pupil-Teacher Ratio
- 1. Vermont
- 2. Maine
- 3. District of Columbia
- 4. New Hampshire
- 5. New Jersey

- 47. Alabama
- 48. Nevada
- 49. California
- 50. Arizona
- 51. Utah
% of Threatened/Injured High School Students
- 1. Delaware
- 2. California
- 3. North Carolina
- 4. Maine
- 5. Massachusetts

- T-40. Idaho
- T-40. Texas
- 42. Kansas
- 43. Alabama
- 44. Mississippi
- 45. Louisiana
Bullying Incidence Rate
- 1. District of Columbia
- 2. Delaware
- 3. Hawaii
- 4. Rhode Island
- 5. Virginia
- 44. Iowa
- 45. Wyoming
- 46. New Hampshire
- 47. West Virginia
- 48. Alaska
Methodology
In order to determine the best and worst states for public-school education, WalletHub compared the 50 states and the District of Columbia across two key dimensions, “Quality” and “Safety.”
We evaluated those dimensions using 32 relevant metrics, which are listed below with their corresponding weights. Each metric was graded on a 100-point scale, with a score of 100 representing the highest quality of public K–12 education.
Finally, we determined each state and the District’s weighted average across all metrics to calculate its overall score and used the resulting scores to rank-order our sample.
Quality – Total Points: 80
Safety – Total Points: 20
Sources: Data used to create this ranking were collected from the U.S. Census Bureau, U.S. Department of Education, National Conference of State Legislatures, National Center for Education Statistics, Centers for Disease Control and Prevention, Western Interstate Commission for Higher Education, Office of Juvenile Justice and Delinquency Prevention, Child and Adolescent Health Measurement Initiative, Education Commission of the States, U.S. News & World Report, College Board, Ballotpedia, ACT, State Educational Technology Directors Association, Civil Rights Data Collection and Zendrive.


